Source infector node ID. Use this ID to extract a single chain


* Zoom in the network diagram to see the contact categories and IDs for person and event nodes

* High risk means Type of contact is Face_to_face_long or Medical_unsave or Touched_fluid or Touched_cloth or Physical_contact else Low risk

* Right click on the network diagram or legend to download or copy.

* The filters are based on complete data. Entities with missing values for the variable used for filtering are not considered

* The data used to generate indicators and figures in this app were obtained from
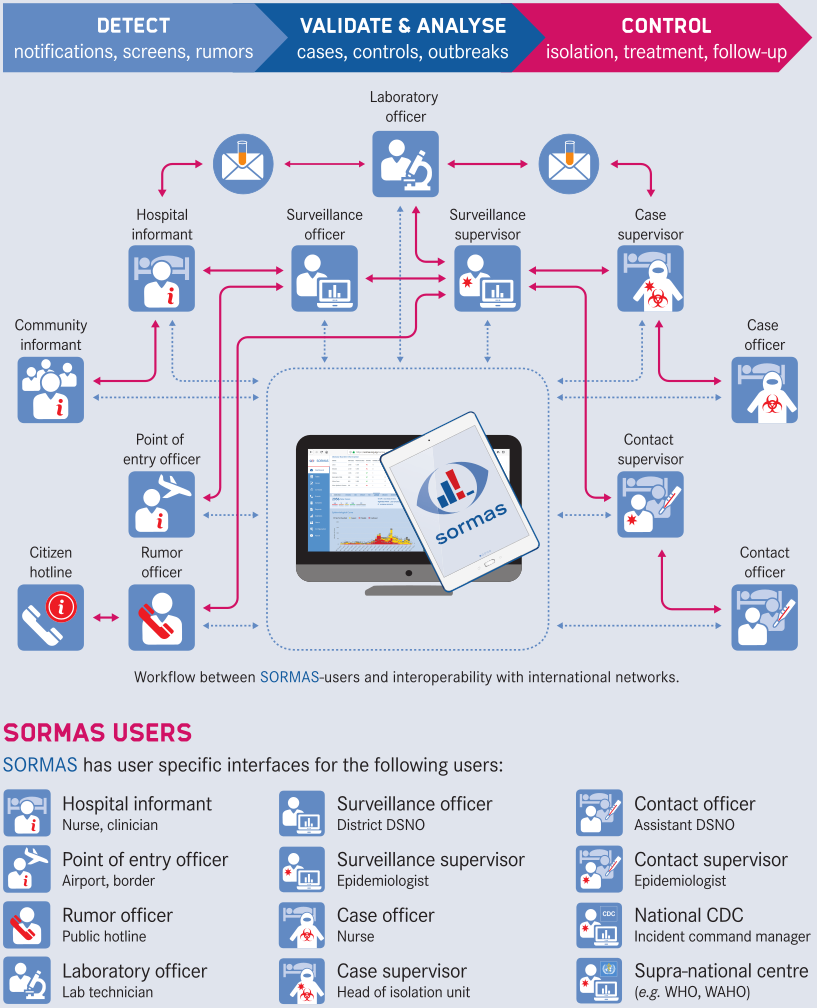
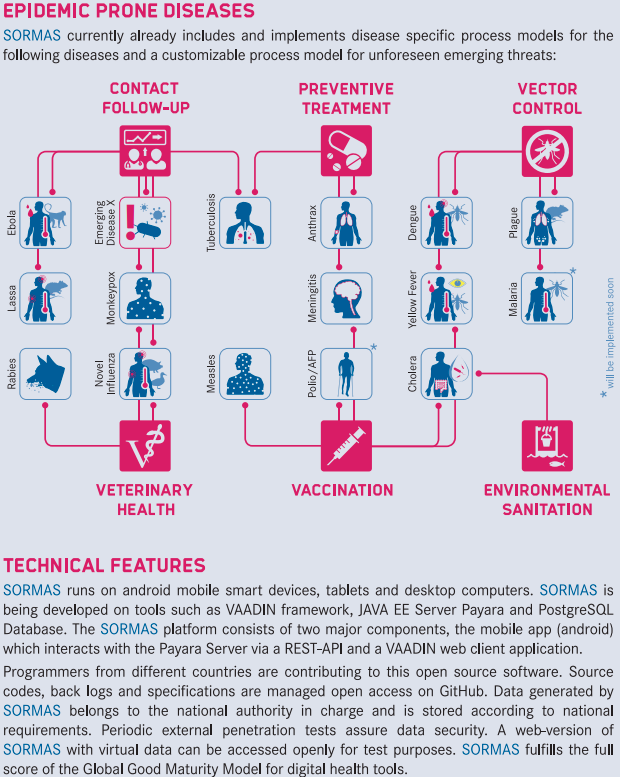
 SORMAS .

Summary indicators

Total node counts by classification

Histogram of betweeness score

Summary of node betweeness


Histogram of number of contacts per node (Node degree)

Summary of number of contacts per node (Node degree)


to

Case classification

Case quarantine

Case gender

Case age

Case outcome

Case occupation

Case Origin


You can request more indicators you want to see here

Meaning of column headers

Name: Name of administrative unit Total: Total number of cases reported within the time interval specified in the filter Total_last24hrs: Total number of cases reported in the last 24 hrs Confirmed: Total number of confirmed cases Probable: Total number of probable cases Unclassified: Total number of unclassified cases Suspected: Total number of suspected cases Deseases: Total number of death cases No_Outcome: Total number of cases with no outcome Recovered: Total number of recovered cases Unk_Outcome: Total number of cases with unknown outcome In_Country: Total number of cases resulting from local transmission Imported: Total number of imported cases Home_Q: Total number of cases quarantine at home Institutional_Q: Total number of cases quarantine in an institution No_Q: Total number of cases that are not on quarantine Other_Q: Total number of cases quarantine at other places Unk_Q: Total number of cases with unknown quarantine

Case pyramid by Sex and Age

Model selection: Goodness-of-fit criteria and statistics. Model with smallest values correspond to distribution with best fit.

Empirical and theoretical CDFs

Q-Q plot

Empirical and theoretical density

Summary statistics for observed serial interval

n_value <= 0: number of records with negative or zero serial interval. This corresponds to asymptomatic transmission.

Parameter estimate and 95% CI of distribtion with best fit to the data

These estimates were estimated using boostrap based on the specified number of iteration specified in the filter. For efficient estimates, set the specified number of iterations to be > 1000. This may takes some time for bootsrap to complete.

Estimate of mean serial interval

Serial interval and fitted distribution for model with best fit to the data

Distributions of number of infectee per infector (offspring distribution)

Summary statistics for observed offspring distribution

n_value <= 0: number of terminal infectee nodes. This corresponds to cases that were infected but did not infect further cases.

Estimates of reproduction number (R) and dispersion parameter (k) using NB distribution

SD: standard deviation, CI: confidence interval, a lower dispersion parameter k indicates higher transmission heterogeneity, i.e. more transmissions resulted from a small number of people.

Estimate of time dependent reproduction number Rt

Summary of estimated mean time dependent reproduction number

to

Bar chart for events by region/district grouped by event status

Table 1: Event status by type of place

Table 2: Event status by management status

Table 3: Event status by risk level

Fig 2: Event status

Fig 3: Event source type

Fig 4: Event district

2 X 2 table. Change filter options plot for other variables.

Dynamic pie chart. Change filter options to plot for another variables.

Dynamic bar graph. Change filter options to plot for another variables.

to

About SORMAS and SORMAS-Stats

The Surveillance, Outbreak Response Management and Analysis System (SORMAS) is an open-source mobile health app that facilitates infectious disease control and outbreak management procedures in addition to disease surveillance and epidemiologic analysis for all levels of a public health system. SORMAS includes specific interfaces for 12 users (e.g., laboratorian, contact tracing officer, epidemiologist), disease-specific process modules for 21 epidemic-prone diseases and a customizable process module for unforeseen emerging diseases and a COVID-19 module, which we developed to support countries in the outbreak response. Users can operate SORMAS on the web or mobile app and synchronize bi-directionally with a central server via mobile telecommunication networks.
SORMAS-Stats contain functions to analyze and visualize surveillance data collected by SORMAS.

Users, diseases and control measures in SORMAS